August update
Welcome to your Microsoft Monthly Insight!
Bringing you the latest in Business Change and Technology, in easily digestible nuggets!
As summer draws to a close Microsoft have been working hard on improving the user experience in Teams Viva, Power BI and many more.
Business Change
This month we highlight ways to improve employees wellbeing, accessiblity and development.
Read on to find out more.
Make your presentations more engaging with Cameo
Launched

Add something to your PowerPoint slides to make them more engaging! With the Cameo feature in PowerPoint, you can insert a live camera feed directly into your presentation. Placing the presenter in the slide with the rest of the content helps all participants follow along more naturally and makes lip reading easier for deaf and hard-of-hearing viewers. Cameo is available in PowerPoint for Windows and Mac, and will appear when you present in PowerPoint Live in Teams as well (in public preview).
And now in Insiders, Cameo with Recording Studio allows you to easily customize the size, position, shape, and effects on your camera feed for a more personal and immersive message within recorded presentations.
Use the employee learning API to integrate with Viva Learning
Launched

Viva Learning is a centralized employee learning hub in Microsoft Teams that lets employees integrate learning and building skills into their work day. Discover, share, recommend, and learn from content libraries provided by both their organization and partners.
The employee learning API in Microsoft Graph enables apps to make content from a Learning Management System (LMS) or learning provider available in Viva Learning. Use the following resources to integrate with Viva Learning:
- Learning provider to manage learning providers, including registering, enabling, disabling, or deleting providers.
- Learning content to upload and manage learning content metadata from your LMS or learning provider in Viva Learning.
As administrators, you can integrate your content and learner records from your LMS or learning provider with Viva Learning, by using out-of-the-box integrations where Viva Learning can pull content metadata and learning records from your LMS or learning provider. You can also use the employee learning API in Microsoft Graph to push content metadata from your LMS or learning provider into Viva Learning. Content will appear on their home page and in either assigned to me or completed.
Microsoft retires Basic Authentication in Exchange Online
Rolling Out

Microsoft will be retiring Basic Authentication in Exchange online this October.
As cyber attacks continue to affect businesses with remote or hybrid workers, Microsoft is working to raise awareness among Exchange Online customers that one of the most important security steps they can take is to move away from outdated, less secure protocols, like Basic Authentication.
This is to encourage users to move over to the more secure Modern Authentication.
Securing email has never been more critical. Email remains essential for sales, productivity, and confidential communication in business, and using Basic Authentication puts companies at greater risk of data breaches and disruption of email. There are 921 password attacks every second, almost doubling the frequency of attacks from 2021.
Find out how you can make your business more secure: Security and Privacy – FITTS
Technology
This month we are focusing on the Power BI update that happened earlier in August. Users offered feedback and Microsoft listened improving conditional formatting and many more features.
Read on to find out more.
Conditional formatting for data labels
Launched
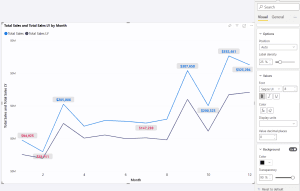
When conditional formatting for data labels first came to Power BI Desktop last year, the scope at which Power BI evaluated your conditional formatting rules was based on the full aggregate of the field across the whole visual, rather than at each data point. This caused all data labels in the visual to come out to the same color.
Now, conditional formatting on data labels for visuals with one or more measures and no field in the legend field well will evaluate for data points. You can find these options for the labels in the formatting pane, under Data labels > Values > Color. You can set conditional formatting rules for all measures or for individual measures.
The conditional formatting rules for data labels that you’ve already set on current reports will not be affected. This is good for preserving backward compatibility, but not good for getting the per-datapoint “correct” behaviour out to authors.
More improvements are coming to visuals and visual formatting next month, so watch this space!
Follow metrics from your mobile app
Launched
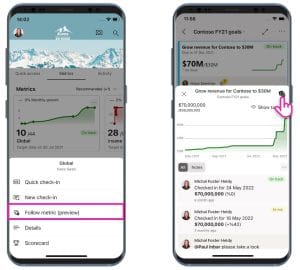
Now you can follow metrics directly from the mobile app and keep up to date with the activity on those metrics. To start following a metric, just tap More options (…) on a metric’s card in the Metrics hub or in the metric’s details pane and choose Follow metric.
To view all the metrics you’re following, select Following in the Metrics display list accessible from the Metrics hub. It makes no difference whether the metric was marked for following in the Power BI service or in the mobile app – you’ll see them all. Likewise, in the Power BI service you’ll also be able to see all your followed metrics – including those that you started following from the mobile app.
Find out about all the new updates: Power BI August 2022 Feature Summary | Microsoft Power BI Blog | Microsoft Power BI
Create a report from the datamart ribbon
Launched
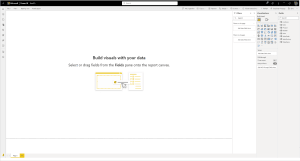
Microsoft has heard your feedback that it can be hard to validate measures and work with the auto-generated dataset within the datamart experience as you want to be able to see your results and also build reports in 1-click. With this update, they’re working to make that experience easier. Users will now be able to create a report while editing or analyzing data within a datamart, which will open a report connected to the dataset in a new tab. This enables a few things:
- End to end report creation, starting from a datamart to an end report in a seamless experience
- Easier development of measures with the ability to refresh the report as new datasets are added
Read more about the datamart update in Power BI: What’s New in Datamart ; August 2022 | Microsoft Power BI Blog | Microsoft Power BI